

PREVIOUS
✖
Tamilnadu’s Economy specials 2026
August 11 , 2026
20 days
1760
0
(இதன் தமிழ் வடிவத்திற்கு இங்கே சொடுக்கவும்)
Stronger growth
-
Between 2021-22 and 2025-26, Tamil Nadu managed to widen its gap with the three smaller economies, while marginally closing its gap with Maharashtra.
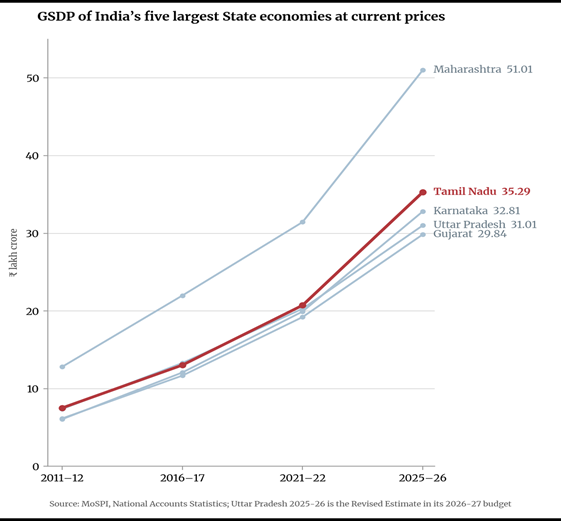
- For instance, in 2021-22, Tamil Nadu’s economy was roughly 8% bigger than Gujarat’s.
- In 2025-26, this widened to 18%.
- Similarly, in 2021-22, Tamil Nadu’s economy was about 66% the size of Maharashtra’s, which grew to 69% in 2025-26.
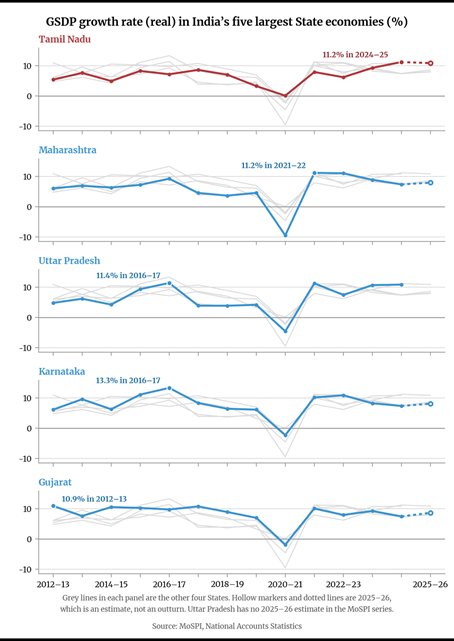
- In terms of post-COVID-19 economic recovery, Tamil Nadu appears to be the only State among the five largest economies whose growth rate has trended upwards (in constant prices).
State’s revenue grew, Central grants shrank
- Tamil Nadu’s own revenue grew at a significant rate in the past five years, with four of those years from 2021-22 to 2024-25 recording double-digit growth rates.
- While the high growth in the first two years in this period, and particularly 2021-22, could be attributed to the COVID-19 pandemic, the State’s own revenue grew at around 11% in 2024-25 as well, before slowing down to 9% in 2025-26, according to the Revised Estimate (RE) presented by the DMK government in its interim budget.
- The years 2023-24 and 2024-25 were the first time when the Centre’s contribution to the State’s revenue receipts, which includes Share in Central taxes and Grants-in-aid, fell, besides the fluctuation seen in 2017-18, when the Goods and Services Tax (GST) kicked in.
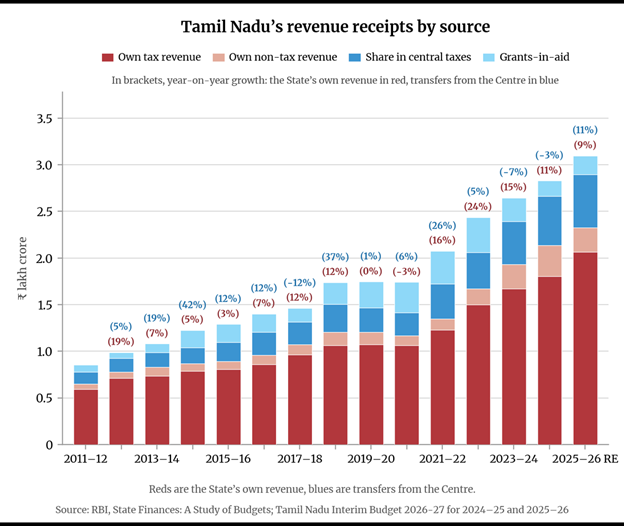
The fall was mainly due to the discontinuation of the GST Compensation Cess in 2022-23 even though many States, including Tamil Nadu, demanded that the compensation be extended for a few more years.
Revenue grew, but not in proportion to economy
Though the State’s revenue grew at a reasonable rate, it has not kept pace with the economy.
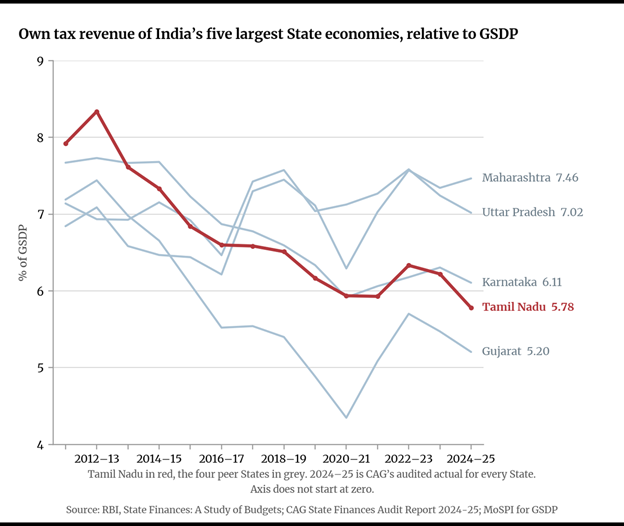
As the chart below shows, the State’s Own Tax Revenue (SOTR), as a proportion of GSDP, has in fact shrunk in the past 15 years.
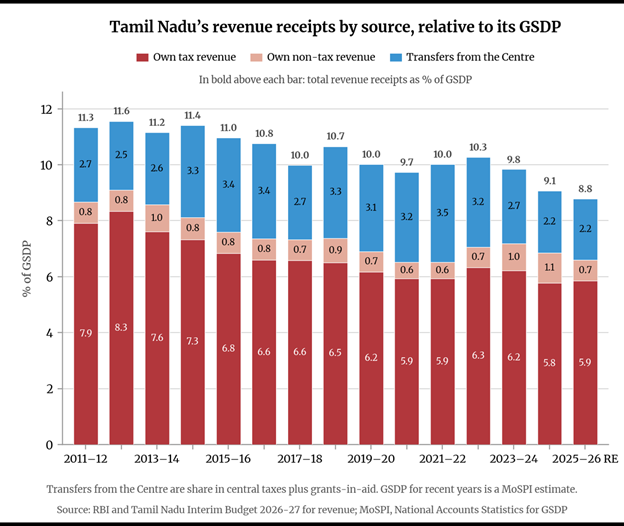
SOTR was 5.8% of Tamil Nadu’s GSDP in 2024-25, compared with 8.3% in 2012-13, the highest in the past one-and-a-half decades.
As the chart shows, the share of Central transfers also contracted, albeit marginally, from 2.7% in 2011-12 to 2.2% in 2024-25.
Debt grew faster than revenue
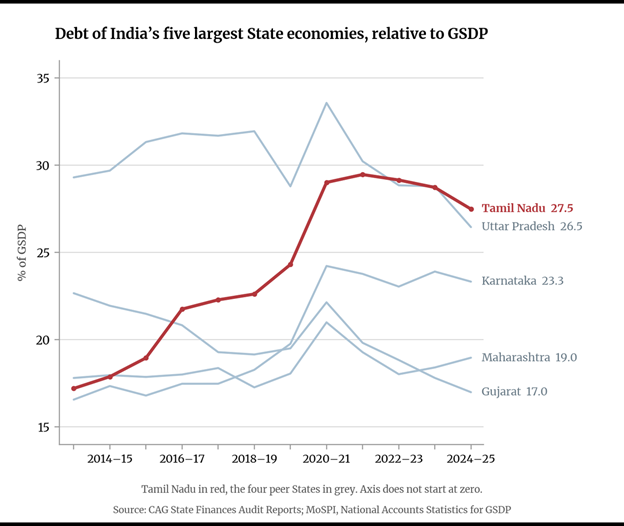
Tamil Nadu’s outstanding debt moved in the opposite direction, rising as a proportion of the State’s economy.
It was at 17.9% in 2014-15 and grew to 27.5% in 2024-25.
Tamil Nadu’s Debt-to-GSDP ratio was the second lowest in 2014-15 among the five big economies; it became the second highest in 2016-17 and the highest in 2024-25 after Uttar Pradesh’s ratio dropped from 28.8% to 26.5%.
The graph below shows Tamil Nadu’s outstanding liabilities, which include the money the State borrowed from the market and other institutions (internal debt), loans from the Centre and public account liabilities that are not borrowings but the money the State holds as a custodian, such as small savings, reserve funds and provident fund balances, among others.
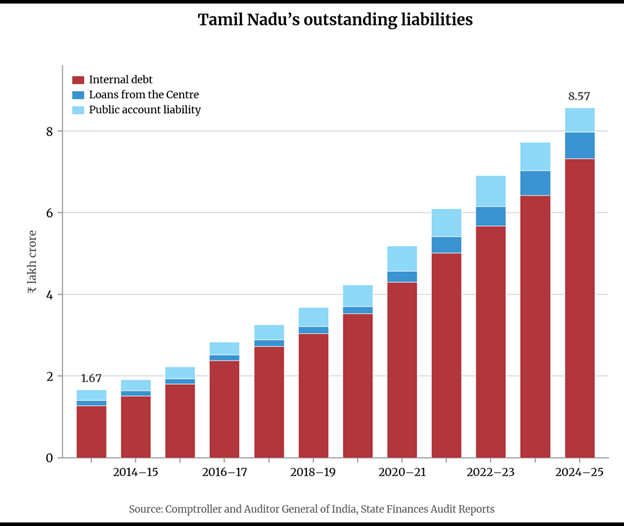
The outstanding liabilities grew at a compound annual growth rate (CAGR) of 16.2% in the ten-year period from ₹1.92 lakh crore in 2014-15 to ₹8.57 lakh crore in 2024-25.
This is nearly twice the CAGR of 8.7% at which SOTR grew in the same period from ₹78,657 crore (2014-15) to ₹1.8 lakh crore (2024-25).
As a consequence, the revenue and fiscal deficits have widened sharply.
Tamil Nadu’s revenue deficit, which accounted for 23.6% of its fiscal deficit in 2014-15, now accounts for 55.8% of its fiscal deficit (2025-26 RE).
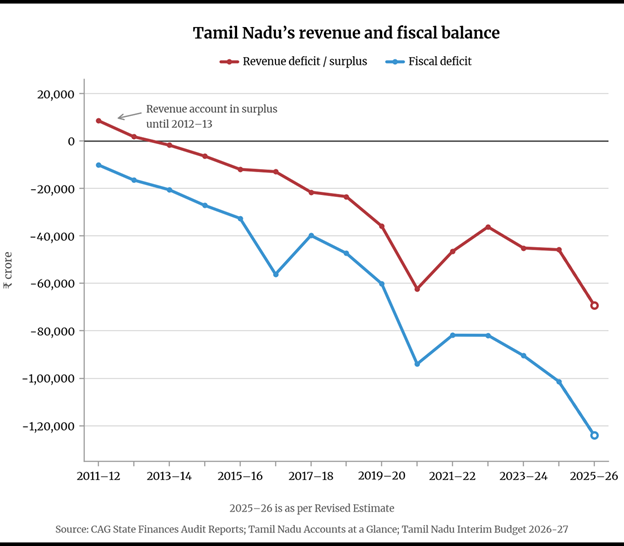
The outgoing DMK government sharply revised the revenue deficit from ₹41,635 crore, as presented in the 2025-26 budget, to ₹69,219 crore in the revised estimate for 2025-26 in its 2026-27 interim budget — an upward revision of 66%.
The TVK government is likely to revise it further upwards, as the white paper brought out in June already indicated that the revenue deficit for 2025-26 had crossed ₹78,000 crore.
The debt-servicing trap
The mounting debt has made interest payments a major liability on the State’s revenues, leaving little room for other expenditure, leading to more borrowings.
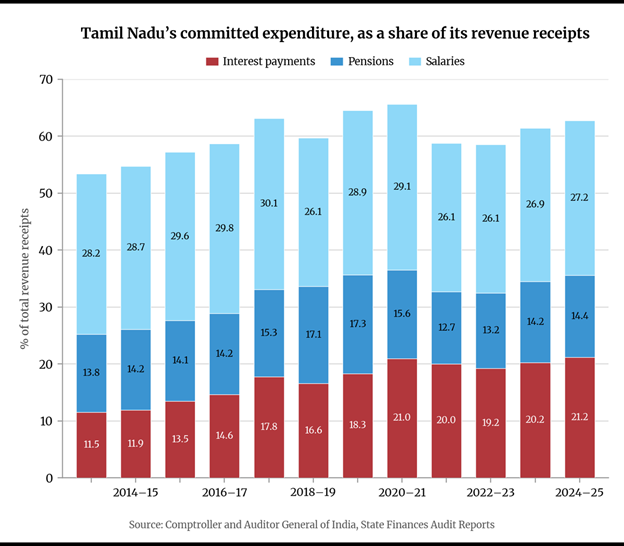
The committed expenditure of the State government broadly includes interest payments, pensions and salaries.
As the chart below shows, Tamil Nadu has managed to retain pensions and salaries at roughly the same levels, as a share of total revenue receipts.
In stark contrast, interest payments as a share of total revenue receipts have nearly doubled from 11.9% in 2014-15 to 21.2% in 2024-25.
Since 2017-18, Tamil Nadu has in fact been spending more on interest payments than on its capital outlay, as shown below.
Interest payments now exceed capital outlay and subsidies.
The subsidies include expenditure on schemes like Kalaignar Magalir Urimai Thogai (KMUT), which offers cash assistance of ₹1,000 per month to about 1.3 crore women heads of households from eligible families, and Vidiyal Payanam (renamed Magalir Payanam by the TVK government), which offers free travel to women in a select fleet of government buses.
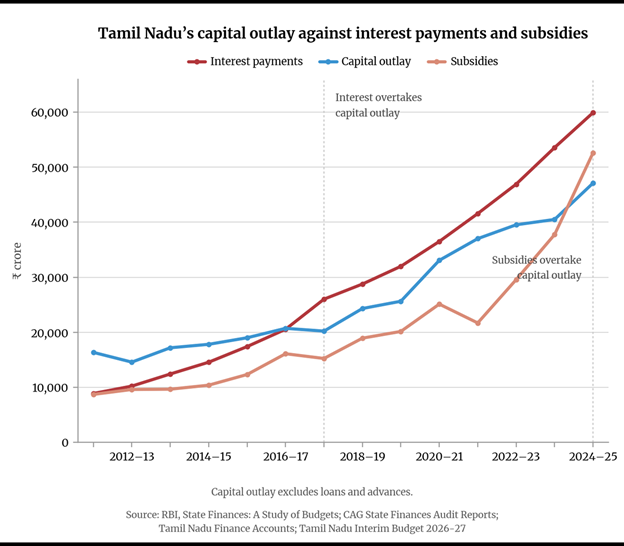
- The sharp rise in the subsidies in 2024-25 is due to the government including the roughly ₹6,000 crore released to Tamil Nadu Power Distribution Corporation Limited for offering free power to farmers.
- This was earlier reported under a different head of the budget.
- The TVK government has already rolled out another of its promises, the Thaai Maaman Thanga Mothiram scheme.
- It is offering a one-gram gold ring to every baby born in a government hospital, with an annual allocation of over ₹750 crore.
- CM had promised in his party’s manifesto to increase the cash assistance under KMUT from ₹1,000 to ₹2,500, besides many other welfares promises that are yet to be implemented.
- In such a scenario, it is unlikely that the government will cut down on subsidies.
- If the government wants to move towards easing the debt burden, the only lever at its disposal seems to be to grow the State’s own revenue, quickly and sharply.

Leave a Reply
Your Comment is awaiting moderation.