PREVIOUS
✖
World No 1 in populated country – India
April 27 , 2023
1183 days
25974
0
(இதன் தமிழ் வடிவத்திற்கு இங்கே சொடுக்கவும்)
- India's population in 2023 stands at 142.86 crore, according to the latest United Nations Population Fund data. India is to overtake China, which has 142.57 crore, to become the most-populous country in the world.
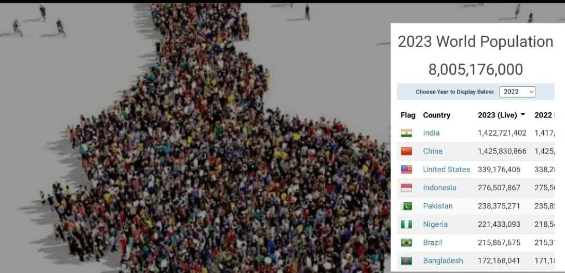
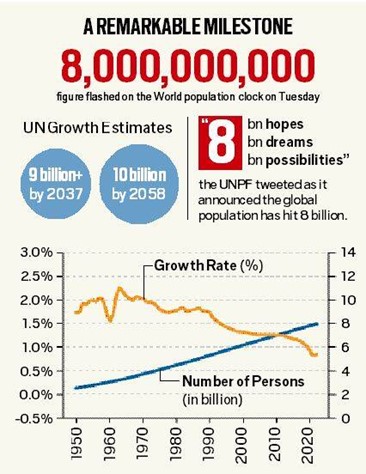
- The global population reached 8 billion on 15 November 2022.
- India is projected to surpass China as the world’s most populous country in 2023, according to World Population Prospects 2022, released today on World Population Day (July 11).
- Asia and Africa drove much of that growth and is expected to drive the next billion in 2037, while Europe's contribution will be negative due to declining population.
- The global population is growing at its slowest rate since 1950, having fallen under 1 per cent in 2020.
- The latest projections by the United Nations suggest that the world’s population could grow to around 8.5 billion in 2030 and 9.7 billion in 2050.
- It is projected to reach a peak of around 10.4 billion people during the 2080s and to remain at that level until 2100.
- World Population Prospects 2022 also states that fertility has fallen markedly in recent decades for many countries.
- Today, two-thirds of the global population lives in a country or area where lifetime fertility is below 2.1 births per woman, roughly the level required for zero growth in the long run for a population with low mortality.
- The populations of 61 countries or areas are projected to decrease by 1 per cent or more between 2022 and 2050, owing to sustained low levels of fertility and, in some cases, elevated rates of emigration.
Population
- The total number of people residing in a country at a specified period of time is called the 'Population' of that country.
Census
- Population census is the total process of collecting, compiling, analysing or otherwise disseminating demographic, economic and social data pertaining, at a specific time, of all persons in a country or a well-defined part of a country.
- It happens in an interval of ten years.
- The data collected through the census are used for administration, planning, policy making as well as management and evaluation of various programmes by the government.
Demographic trends in India
- Scientific study of the characteristics of population is known as Demography.
Size of Population
- Over a period of 100 years, India has quadrupled its population size.
- In terms of size of population, India ranks 2nd in the world after China.
- India has only about 2.4% of the world’s geographical area and contributes less than 1.2% of the world’s income, but accommodates about 17.5% of the world’s population.
- In other words, every 6th person in the world is an Indian.
Population Growth and Change
- The growth rate of population is an important demographic feature.
- It not only helps in understanding the population change that a society has undergone in the past but also helps in predicting the future demographic characteristics of an area.
- Population growth refers to the change in the number of inhabitants of a country/territory during a specified period of time.
- The growth of population is expressed in percentage and is described as the growth rate of population.
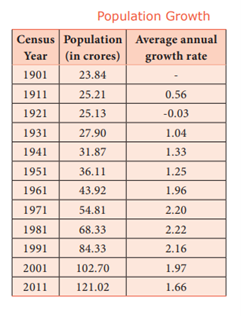
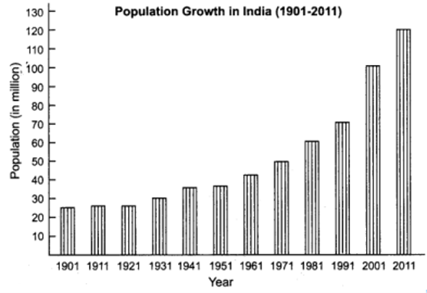
- The following table shows the decadal growth rate of population from 1901 to 2011.
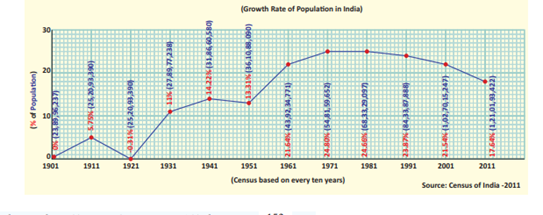
- Growth of population in India has gone through the different phases.
- Population of the country in 1901 was 238 million and it grew to 1,210 million over a period of little more than a century.
- The following are the different stages of population growth of India.
Period of Stagnant Population (1901-1921)
- During the first phase of 20 years (1901-1921), the population of India grew by 15 million.
- The year 1921 registered a negative growth rate of -0.31% which happened only once throughout the demographic history of India and is called the year of Great Demographic Divide.
- The negative growth during 1911-21 was due to rapid and frequent occurrence of epidemics like cholera, plague and influenza and also famines.
- The year 1921 is known as the ‘Year of Great Divide’ for India’s population as population starts increasing.
Period of Steady Growth (1921 - 1951)
- During the second phase of 30 years (1921-1951), the population of India grew by 110 million.
- During 1951, the population growth rate has come down from 1.33% to 1.25%. Hence it is known as the 'Year of Small divide'.
Period of Steady Growth (1951 - 1981)
- During the third phase (1951 - 1981), the population of India grew from 361 million in 1951 to 683 million in 1981.
- Growth rate in this period is almost doubled when compared to the previous phase of growth rate.
- This period is often referred to as the period of population explosion.
- In 1961, population of India started increasing at the rate of 1.96% i.e., 2%.
- Hence 1961 is known as ‘Year of Population Explosion’.
Period of High Growth with Definite Signs of Slowing Down (1981- 2011)
- Population of India increased from 685 million to 1210 million during this phase.
- The growth rate of population decreased from one census to other. This marks the beginning of a new era in the demographic history of India.
- Population change refers Population change refers to an increase or decrease of population of an area from one period to another period.
- In the year 2001, the Population of India crossed one billion (100 crore) mark.
- The 2011 census reveals growth of youth population which is described as ‘demographic transition’.
- Population growth is influenced by the birth rate, death rate and migration.
- These three make the changes in population.
- Birth rate refers to the number of live births per thousand people in a year and the Death rate refers to the number of deaths per thousand people in a year.
- The rapid decline in death rate is the major cause of the rapid growth of population in India.
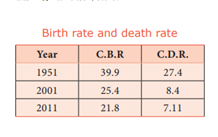
Birth rate and death rate
- Crude Birth rate: It refers to the number of births per thousand of population.
- Crude Death rate: It refers to the number of deaths per thousand of population.
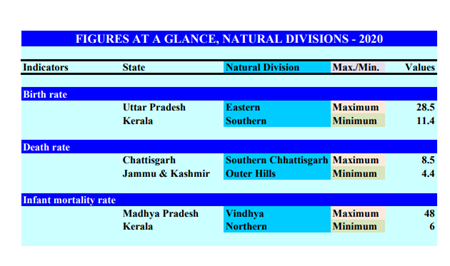
- According to 2011 census, Kerala has the lowest birth rate (14.7) and Uttar Pradesh has the highest birth rate (29.5).
- West Bengal has the lowest death rate (6.3) and Orissa (9.2) has the highest.
- Among States, Bihar has the highest decadal (2001-11) growth rate of population, while Kerala has the lowest growth rate.
- The four states Bihar, Madhya Pradesh, Rajasthan and Uttar Pradesh called BIMARU states have very high population.
- As per the Sample Registration System (SRS) Statistical Report 2020, released on 22nd September 2022 by Registrar General of India (RGI), the country has been witnessing a progressive reduction in IMR, U5MR and NMR since 2014 towards achieving the Sustainable Development Goals (SDG) targets by 2030.
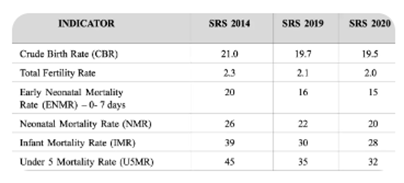
- According to Sample Registration System (SRS) Statistical Report 2020, India Crude birth rate is 19.5.
- In 2020, birth rate for Tamil Nadu was 13.8 births per 1000 inhabitants. Birth rate of Tamil Nadu fell gradually from 19 births per 1000 inhabitants in 2001 to 13.8 births per 1000 inhabitants in 2020.
- Among the bigger States/UTs, the maximum Crude Birth Rate has been reported in Bihar (25.5) and the minimum in Kerala (13.2).
- In 2020, India Crude Death rate is 6.0.
- In 2020, Chhattisgarh has recorded the highest Death Rate of 7.9, whereas the lowest Death Rate has been recorded in Delhi at 3.6.
- The crude death rate of Tamilnadu have declined from 7.4 in 2005 to 6.1 in 2019.
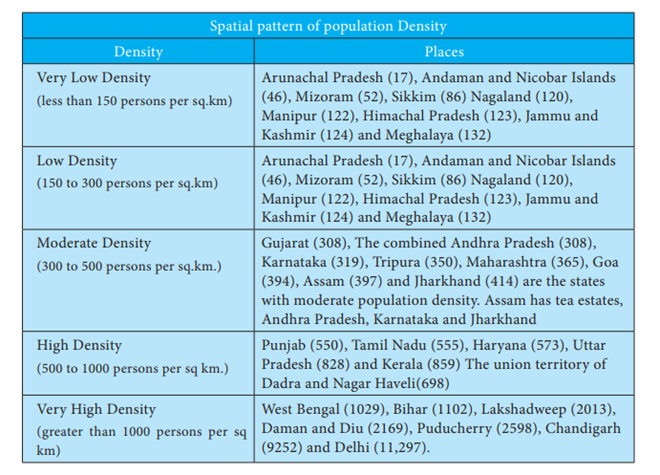
Density of population
- It refers to the average number of persons residing per square kilometre.
- It represents the man- land ratio. As the total land area remains the same, an increase in population causes density of population to rise.
- Density of population = Total population /Land area of the region.
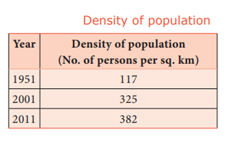
- According to 2011 census, the present Density of population is 382. Thus, the pressure of population on land has been rising.
- Kerala, West Bengal, Bihar and Uttar Pradesh have density higher than the India’s average density.
- Bihar is the most densely populated state in the country with 1,102 persons living per sq.km followed by West Bengal with 880.
- Arunachal Pradesh has low density of population of only 17 persons.
- Then Tamilnadu density of population value is 555 and this value is higher than Indian’s average density.
Sex ratio
- It refers to the number of females per 1,000 males.
- It is an important indicator to measure the extent of prevailing equity between males and females at a given point of time.
- In India, the sex ratio is more favourable to males than to females.
- The recent census (2011) shows that there has been a marginal increase in sex ratio.
- Haryana has the lowest sex ratio of 877 (2011) among other states, while Kerala provides better status to women as compared to other States with 1084 females per 1000 males.
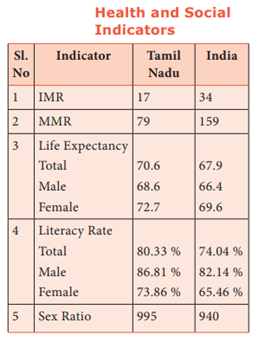
- According to 2011 census India and Tamilnadu Sex ratio value is 940 and 995.
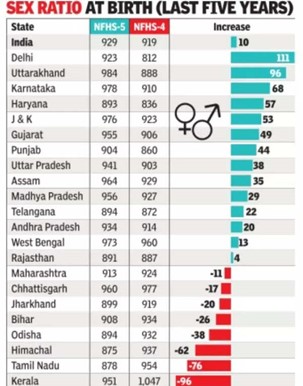
- As per the fifth round of the National Family Health Survey – NFHS (2019-21), the sex ratio of the population (females per 1000 males) for the country was estimated as 1020.
- Karnataka and Tamil Nadu's sex ratio for total population has also improved by 6 percent and 5 percent to 1034 and 1088 respectively.
- Himachal Pradesh is the only large state in the country to witness a decline in its sex ratio of total population from 1078 (NFHS-4) to 1040 (NFHS-5).
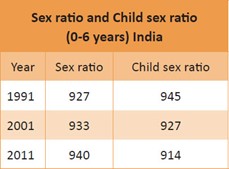
Child Sex ratio
- The child sex ratio is defined as the number of females per thousand males in the age group 0–6 years in a human population.
- According to 2011 census India and Tamilnadu Child Sex ratio value is 943 and 919.
- Arunachal Pradesh (972) has the highest Child Sex ratio among the states in India, while Haryana (834) had the lowest.
- As per the fifth round of the National Family Health Survey (2019-21), the child sex ratio of the population (females per 1000 males) for the country was estimated as 929.
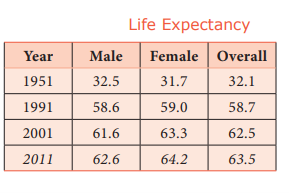
Life expectancy at birth
- It refers to the mean expectation of life at birth. Life expectancy has improved over the years
- Life expectancy is low when death rate is high and / or instances of early death are high.
- On the other hand, life expectancy is high when death rate is low and / or instances of early death are low.
- During 1901 – 11, life expectancy was just 23 years.
- It increased to 63.5 years in 2011.
- A considerable fall in death rate is responsible for improvement in the life expectancy at birth.
- However, the life expectancy in India is very low compared to that of developed countries.
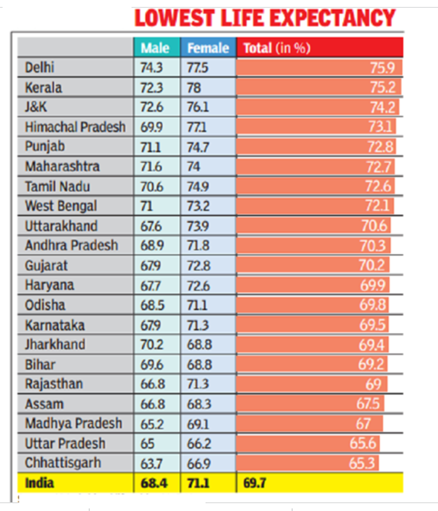
- According to 2011 census, Kerala (74.9) has the highest life expectancy among the states in India, while Assam (62) had the lowest.
- Tamilnadu life expectancy rate is 70.6.
- According to SRS report 2020, India’s life expectancy at birth inched up to 69.7 in the 2015-19 period, well below the estimated global average life expectancy of 72.6 years.
- It has taken almost ten years to add two years to life expectancy.
- Over a 45-year period, India had added about 20 years to its life expectancy at birth from 49.7 in 1970-75 to 69.7 by 2015-19.
- Odisha has had the highest increase, of over 24 years, from 45.7 to 69.8 years followed by Tamil Nadu, where it increased from 49.6 to 72.6.
- Uttar Pradesh had the second lowest life expectancy of 65.6 in 2015-19, after Chhattisgarh with just 65.3.
- However, from having the lowest life expectancy in India of just 43 years in 1970-75, it has increased by 22.6 years in Uttar Pradesh.
-
Infant Mortality Rate (IMR)
- Infant mortality rate refers to the number of deaths per 1000 live births of children under one year of age.
- According to NITI AAYOG, the IMR is 17 (per 1000) for Tamil Nadu which is just half of national average of 34 as on 2016.
- According to SRS report 2020, Infant Mortality Rate (IMR) has also registered 2-point decline to 28 per 1000 live births in 2020 from 30 per 1000 live births in 2019 (Annual Decline Rate: 6.7%).
- The Rural-Urban difference has narrowed to 12 points (Urban 19, Rural 31).
- No gender differential has observed in 2020 (Male - 28, Female - 28).
- Assam has the highest Infant Mortality Rate and is 60.0 among the states in India, while Kerala had the lowest value is 12.2.
Maternal Mortality Rate (MMR)
- MMR is the annual number of maternal deaths per 100,000 live births.
- Tamil Nadu has a good record of controlling MMR, ranking third with 79 (Kerala 61, Maharashtra 67) against national average of 159 again half of the national average [NITI AAYOG]
- Assam (195) has the highest incidence of premature maternal deaths compared to all other states in the country.
- According to SRS report 2020, MMR in the country declined from 130 per lakh live births in 2014-16 to 122 in 2015-17, and further dropped by 9 points to 113 in 2016-18. By 2017-19, India’s MMR was already down to 103, against a global MMR of 211 (2017).
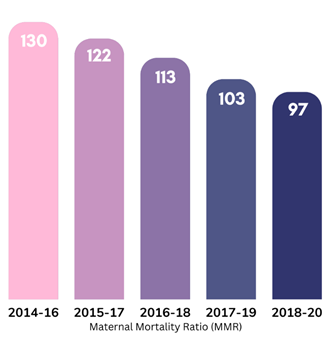
- Sustainable Development Goals (SDG) set by the United Nations in 2015 is to reduce the global MMR to less than 70/lakh live births by 2030.
- India is steadily advancing on the track to achieve this goal ahead of time with its policies for women’s health and wellbeing.
- The steps taken by the Central Government have facilitated outstanding progress by a number of states, eight of which have already achieved the SDG target.
- These include Kerala (19), Maharashtra (33), Telangana (43) Andhra Pradesh (45), Tamil Nadu (54), Jharkhand (56), Gujarat (57), and Karnataka (69).
- The MMR was the highest in Assam with 195, followed by Madhya Pradesh and Uttar Pradesh with 173 and 167 respectively.
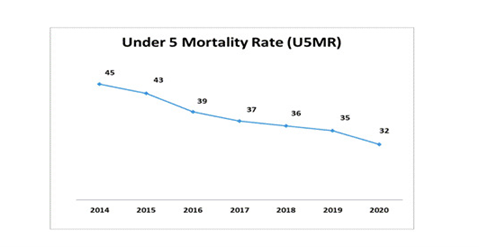
Under 5 Mortality Rate (U5MR)
- The under-five mortality rate refers to the probability of dying - before age 5 years per 1,000 new borns.
- According to 2011 census, Tamilnadu Under 5 Mortality Rate is 79.
- India Under 5 Mortality Rate is 159.
- Uttar Pradesh has the highest Under 5 Mortality Rate among the states in India, while Kerala had the lowest.
- According to Sample Registration System (SRS) Statistical Report 2020, Under 5 Mortality Rate (U5MR) for the country has shown significant decline of 3 points (Annual Decline Rate: 8.6%) from 2019 (32 per 1000 live births in 2020 against 35 per 1000 live births in 2019).
- It varies from 36 in rural areas to 21 in urban areas.
- U5MR for Female is higher (33) than male (31). There has been a decline of 4 points in male U5MR and 3 points in female U5MR during the corresponding period.
- Highest decline of U5MR is observed in the State of Uttar Pradesh (5 points) and Karnataka (5 points)
- Kerala had the lowest U5MR is 6.
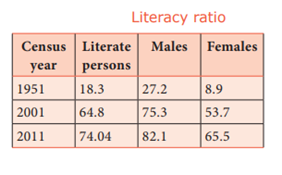
Literacy ratio
- It refers to the number of literates as a percentage of the total population.
- In 1951, only one-fourth of the males and one-twelfth of the females were literates.
- Thus, on an average, only one-sixth of the people of the country were literates.
- In 2011, 82% of males and 65.5% of females were literates giving an overall literacy rate of 74.04% (2011). When compared to other developed countries and even Sri Lanka this rate is very low.
- Kerala has the highest literacy ratio (94%), Mizoram (91.3%), followed by Goa (88.7%), Himachal Pradesh (82.8%), Maharashtra (82.3%), Sikkim (81.4%), and Tamil Nadu (80.1%).
- Bihar has the lowest literacy ratio (61.8%) in 2011.
Opportunities of over Population
- Farming and industry have been able to benefit from economies of scale, which means as the population grows, food output and manufacturing output have been able to grow even faster than population growth.
- Higher populations can enable a critical mass of people to have a more vibrant society.
- When the population grows, it can enable the support of a broader cultural range of activities.
- The size of the population is intimately connected to the power dynamics shaping the relationship between nations, regions and generations.
- It is, however, a double-edged sword that needs to be skilfully wielded.
-
Claim for permanent member at UNSC:
- If India becomes the largest country, it will give Indians a claim to be the permanent member of the Security Council.
- New population will push its existing demand for a permanent seat on the UN Security Council.
- The geopolitical reality has changed and new powers have emerged which deserve a place alongside the old – Russia, the UK, China, France and the United States.
- Increase in Fiscal Space: Fiscal resources can be diverted from spending on children to investing in modern physical and human infrastructure that will increase economic sustainability of India.
- Rise in Workforce: With more than 65% of the working age population, India can rise as an economic superpower, supplying more than half of Asia’s potential workforce over the coming decades.
- Increase in the Labour Force that enhances the productivity of the economy.
- Rise in Women’s Workforce that naturally accompanies a decline in fertility, and which can be a new source of growth.
- The rising young population provides India with a great opportunity for growth, peppered with the possibility of path-breaking innovation.
- India’s population heterogeneity ensures that this window of demographic dividend becomes available at different times in different States.
- Population growth will lead to economic growth with more people able to produce more goods.
- It will lead to higher tax revenues which can be spent on public goods, such as health care and environmental projects.
Challenges of over Population
- High population growth also affects the depletion of resources.
- Having the most people on the planet could prove to be a big negative for India unless it can provide food, education, housing, health services and jobs to its people.
- The scale of this challenge is gigantic.
- Across India, water scarcity is a chronic issue. All these needs are crucial but by far the single most important thing for India to do is to generate jobs. The scale of this particular challenge is truly daunting.
- In 2020, India has 900 million people (67% of the total population) in the working age group of 15-64.
- This is expected to expand by another 100 million by 2030.
- The increase in the working-age population may lead to rising unemployment, fuelling economic and social risks.
- The 65+ category is going to grow quite fast and it faces several challenges.
- Provisioning of social security is obviously a big challenge. This will stretch the resources of the future governments.
- Education is an enabler to bridge gender differentials.
- In India, boys are more likely to be enrolled in secondary and tertiary school than girls.
- Further gender inequality in education may increase.
Measures to control overpopulation
- Here are some unique solutions to overpopulation
Creating Awareness Campaigns
- Using both social and mainstream media, we can clearly tell people around the world the truth about overpopulation crises and what must be done to solve them the right way.
Promotion of Adopting child
- Adoption become a consideration for family planning, particularly among socially conscientious communities.
- And today, it has become a de-facto solution for people who are interested in starting a family, yet having concerns about overpopulation.
Aiming for Single-Child Families
- According to statistics, hundreds of thousands of people are being added to the planet every day, which is an unsustainable rate.
- Hence, it is need of hour we should aim for single-child families.
National Security issue
- Over populated countries should treat population boom as an issue of national security.
- As you can see, similar to food insecurity and climate change, uncontrolled and rapid population growth can be a national security threat in a way that it results to instability.
Changing Social Norms
- Some couple choose not to have children and we have to respect their decision.
- This way we will be able to help curb the problem of overpopulation.
Providing Tax Benefits or Concessions
- Governments of various countries can come up with various regulations and policies related to tax exemption to help solve overpopulation.
- For example, they can waive certain parts of income tax or lower income tax rates for couples who have one or two children.
- In human populations, overpopulation is the state of being in which the population of a city or region is so great that it causes problems such as a shortage of food, a shortage of housing, and a shortage of jobs.
- Overpopulation is a cause of poverty, and it has a negative impact on the economy. It is also a cause of environmental degradation.
- The most common causes of overpopulation are high birth rates and long-life expectancies. Overpopulation is one of the most significant causes of human-induced climate change. So, overpopulation has a negative impact on Indian society.
- - - - - - - - - - - - - - - - - - - - - -

Leave a Reply
Your Comment is awaiting moderation.