PREVIOUS
✖
Annual Survey of Industries 2023–24
September 1 , 2025
16 hrs 0 min
21
0
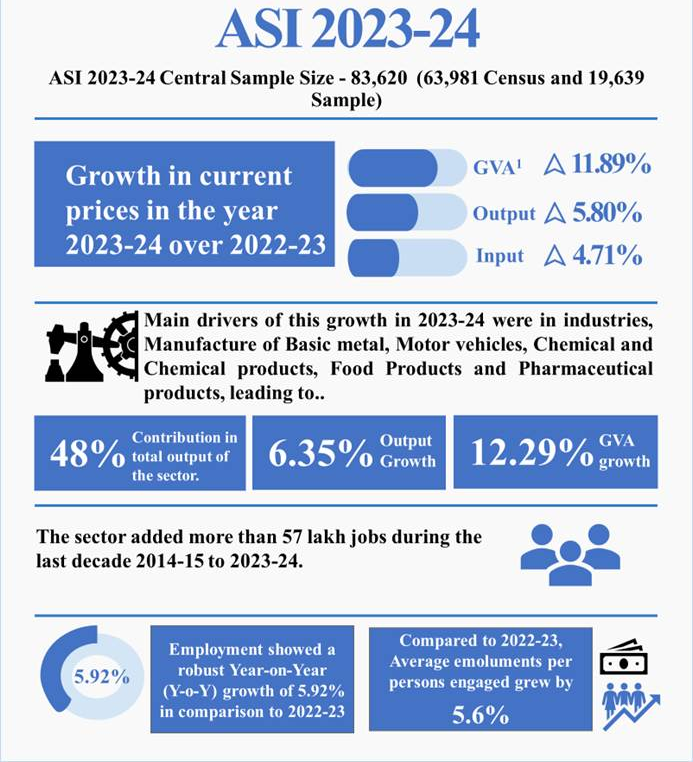
- The Ministry of Statistics and Programme Implementation released the Annual Survey of Industries (ASI) 2023–24 covering the period April 2023 to March 2024.
- Gross Value Added (GVA) at current prices increased by 11.89 percent in 2023–24 over 2022–23, reaching ₹24,58,33,605 lakh.
- Industrial output rose by 5.80 percent in 2023–24, with total output valued at ₹1,53,27,16,609 lakh.
- Total employment in the sector increased by 5.92 percent, rising to 1,95,89,131 persons in 2023–24.
- Between 2014–15 and 2023–24, the sector added over 57 lakh new jobs.
- Basic metals contributed 11.56 percent to total GVA, the highest among all industry groups.
- Tamil Nadu, Gujarat, Maharashtra, Uttar Pradesh, and Karnataka were the top five states in terms of total employment.
- Maharashtra led in Gross Value Added with a share of 15.95 percent, followed by Gujarat and Tamil Nadu.
- Gujarat had the highest share of fixed capital at 19.53 percent of the national total.
- The total number of factories reported in ASI 2023–24 was 2,60,061.
- The share of contract workers to total workers increased to 0.42 in 2023–24.
- The fixed capital to Net Value Added ratio remained at 2.20, indicating capital efficiency.
- The top five states by number of factories were Tamil Nadu, Gujarat, Maharashtra, Uttar Pradesh, and Andhra Pradesh.
- The top five states by fixed capital were Gujarat, Maharashtra, Tamil Nadu, Odisha, and Karnataka.
- The top five states by gross output were Gujarat, Maharashtra, Tamil Nadu, Haryana, and Uttar Pradesh.
- The top five states by GVA were Maharashtra, Gujarat, Tamil Nadu, Karnataka, and Uttar Pradesh.
- The top ten industries contributed 71 percent of the total manufacturing Gross Value Added.
- The top five states accounted for about 54 percent of the manufacturing Gross Value Added and 55 percent of total employment.

Leave a Reply
Your Comment is awaiting moderation.