PREVIOUS
✖
Tamil Nadu's debt in 2025
January 5 , 2026
14 hrs 0 min
153
0
- In 2010, Uttar Pradesh had more than double the debt of Tamil Nadu.
- Today, Tamil Nadu’s outstanding debt is higher than Uttar Pradesh’s.
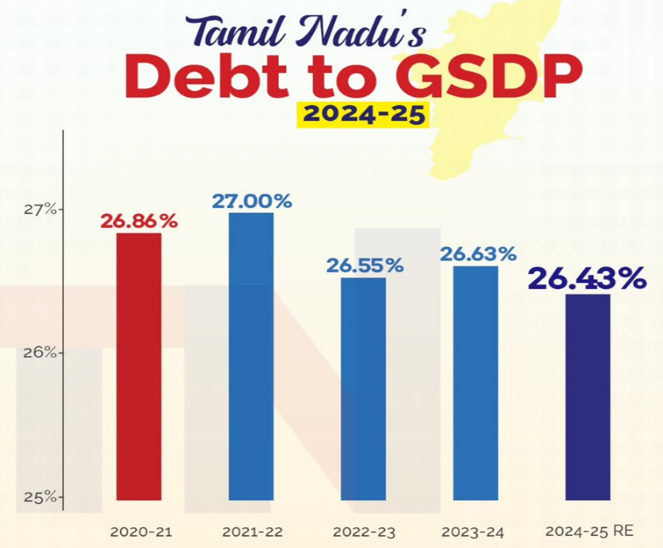
- As of 2025-26, Tamil Nadu’s outstanding debt is estimated at 26.1% of gross state domestic product (GSDP), down from 26.4% in 2024-25 and 26.6% in 2023-24.
- Tamil Nadu’s debt ratio has been on a gradual downward path since its COVID-19 peak, though it remains above pre-Covid levels.
- Uttar Pradesh, by contrast, is estimated to end 2025-26 with outstanding liabilities of 29.4% of GSDP, also declining from 30.8% in 2024-25.
- U.P. remains more indebted than Tamil Nadu relative to the size of its economy, even though Tamil Nadu’s absolute debt stock is now higher.
- Tamil Nadu’s economy, at ₹35.7 lakh crore GSDP in 2025-26, is significantly larger per capita than Uttar Pradesh’s ₹30.8 lakh crore economy, despite U.P. having nearly three times the population.
- Tamil Nadu does spend a high share of its revenue receipts on interest payments, about 21% in 2025-26.
- That places it among the higher-interest-burden States.
- Tamil Nadu’s fiscal deficit is projected at 3% of GSDP in 2025-26, lower than the 3.3% revised estimate for 2024-25, and fully within the Fiscal Responsibility and Budget Management (FRBM) framework.
- Over the ten-year period from 2012-13 to 2021-22, Tamil Nadu’s average real GDP growth has exceeded its average real effective interest rate by about 2.1 percentage points.
- while even in the more recent five-year window, which includes the Covid pandemic shock, the growth-interest differential remains positive at 1.3 percentage points
- when growth persistently exceeds the effective cost of borrowing, debt ratios stabilise or decline unless primary deficits are very large
- In this, Tamil Nadu’s case have been below 2% of GSDP.
- Notably between 2020-21 and 2023-24, Tamil Nadu maintained real GSDP growth averaging above 7%, with services and manufacturing consistently expanding.
- The economy did not stagnate under debt rather it expanded through it.
- Tamil Nadu’s per capita GSDP in 2023-24 stood at ₹3.53 lakh, more than three times Uttar Pradesh’s ₹1.07 lakh.
- This reflects decades of higher productivity, industrialisation, and human capital formation.
- Tamil Nadu is far more urbanised, which matters because it correlates with higher tax capacity, better service delivery, and more diversified employment.
- Human development indicators reinforce this picture.
- Tamil Nadu consistently outperforms most States on literacy, health access, and demographic transition.
- These outcomes reduce long-term fiscal pressures by lowering dependency ratios and improving labour productivity.
- Where Tamil Nadu’s story becomes most forward-looking is in investment and economic composition.
- In 2025-26, Tamil Nadu planned a 22% increase in capital outlays.
- Debt that finances future productivity is not the same as debt that merely fills revenue gaps. The composition of expenditure matters, and Tamil Nadu’s capital-heavy budget tilt suggests an economy still investing its way forward.
- Tamil Nadu raises 75% of its revenue receipts from its own resources.
- 25% comes from its share in central taxes and via grants.
- Uttar Pradesh, by contrast, depends on the Centre for over half of its revenue receipts.
- This reflects stronger tax bases, higher compliance, and denser economic activity in Tamil Nadu.
- States that industrialised early, invested in human development, and controlled population growth, now face tighter borrowing constraints and lower transfers, even as they continue to contribute disproportionately to national growth and tax collections.
- It is about what States did with their borrowing, what economies they built, and what futures they are financing.

Leave a Reply
Your Comment is awaiting moderation.