PREVIOUS
✖
Tamilnadu Economy 2026
June 24 , 2026
14 hrs 0 min
92
0
- The Government of Tamil Nadu’s white paper is a comprehensive analysis of the State’s financial status and economic conditions.
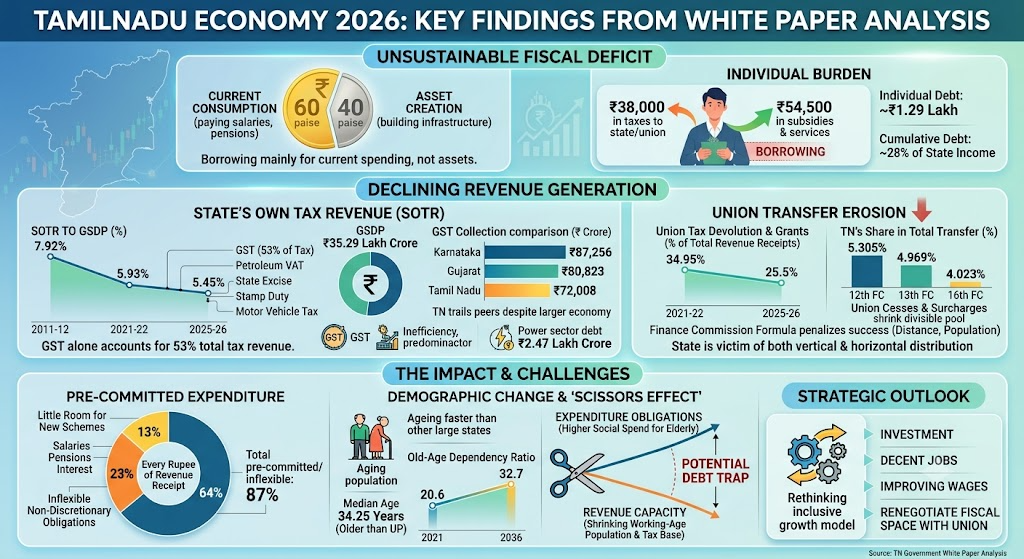
- It states that “the current levels of fiscal deficit are unsustainable primarily because a substantial portion of the fiscal deficit is simply to fund the revenue deficit”.
- It means the State is simply borrowing to fund current consumption rather than to create assets.
- To be sure, for every rupee borrowed, about 60 paise goes to current consumption.
- The substantial expenditure for health and education is under the revenue account.
- In an economy, the government needs to raise resources to pay for the provision of public goods and services, build social and physical infrastructures needed for growth and protect the vulnerable from the market forces.
- An individual pays ₹38,000 in all taxes to the State and the Union government and receives about ₹54,500 worth of subsidies and services.
- The gap is typically funded by borrowing.
- The consolidated debt of each individual is then around ₹1.29 lakh, and the cumulative debt is about 28% of the State's income.
- The serious concern that the report flags is not just debt, but the collapse of the revenue generation itself.
- While the white paper shows the account of revenue generation of the past five years, the collapse precedes this by at least a decade.
- Tamil Nadu was one of the few States that predominantly sustained itself on its own revenue for its expenditure, about 70% of its expenditure from its own tax.
- It was in sharp contrast to States such as Bihar and Uttar Pradesh, which largely rely on the Centre’s transfer.
- With the introduction of the GST in 2017, States have lost their sovereignty on taxation.
- Tamil Nadu suffered the most.
- The State’s Own Tax Revenue (SOTR) to GSDP, which was 7.92% in 2011-12, has been steadily declining, and was down to 5.93% in 2021-22 and further down to 5.45% in 2025-26.
- While the white paper clearly shows that the decline is spread across all major tax heads — GST, petroleum VAT, State excise, stamp duty and motor vehicle tax, the GST alone accounts for about 53% total tax revenue.
- Despite having the second-largest economy with a GSDP of ₹ 35.29 lakh crore, its GST collection was ₹72,008 crore lower than that of Karnataka (₹87,256 crore) and Gujarat (₹80,823 crore).
- Besides the systemic corruption and inefficiencies in tax collection, the predominance of the service sector also contributed to the decline in GST collection.
- The power sector alone carries ₹2.47 lakh crore of debt.
- Besides the steady decline in its own tax collection, the State has also been increasingly losing its share in the Union transfer.
- For instance, Union tax devolution and grants-in-aid together constituted about 34.95% of Total Revenue Receipts in 2021-22, and it declined to 25.5% in 2025-26.
- The State’s share in total transfer was 5.305% in the 12th Finance Commission period, but it came down to 4.969% in the 13th Finance Commission period and fell down to 4.023% for the 16th Commission.
- This declining share is due to the formula adopted by the successive Finance Commissions.
- The high weightage to the per capita income distance, combined with population, has disadvantages.
- The State has become a victim of its success.
- Even the weight GDP contribution introduced in the 16th Finance Commission did not help, as the formula was inverted.
- Neither the criteria of area nor forest cover could help.
- On the other hand, the shareable divisible pool has been shrinking thanks to the arbitrary cess and surcharges imposed by the Union government that take away the legitimate resources of the States.
- In that sense, the State is a victim of both vertical and horizontal distribution.
- With declining Union transfers and the erosion of its own revenue base, Tamil Nadu’s government size, measured by total expenditure as a share of GSDP, has shrunk, weakening the State’s fiscal capacity.
- As the white paper shows, about 64% of every rupee of revenue receipts in 2025-26 is pre-committed on the account of salaries, pensions and interest.
- With the inflexible non-discretionary obligations of 23% per cent, this pre-committed expenditure goes up to 87%, leaving little room for any additional expenditure or any new schemes.
- This potential debt trap also comes at a time when the State is witnessing faster demographic change.
- It’s ageing faster than any other large State in India.
- Tamil Nadu’s median age is 34.25 years — nearly 9.5 years older than Uttar Pradesh, and its old-age dependency ratio is projected to increase from 20.6 in 2021 to 32.7 by 2036.
- This has two implications.
- The ability to repay the debt is limited, the paper argues, because a shrinking working-age population means a shrinking tax base.
- It also means the need for higher social expenditure as the share of the elderly population goes up.
- The interaction between a rising debt stock and a shrinking working-age population can create conditions for a debt trap, which demographers call the ‘scissors effect’ — the widening gap between revenue capacity and expenditure obligations.
- However, Tamil Nadu’s problem today is not fiscal profligacy or corruption.
- The pressing problem is the model of inclusive growth itself.
- The real challenge thus is getting investment, generating decent jobs, improving wages, while actively renegotiating fiscal space with the Union.

Leave a Reply
Your Comment is awaiting moderation.