

PREVIOUS
✖
TN government’s White Paper 2026
June 19 , 2026
100 days
3674
0
- The State Govt released the White Paper on the Fiscal Management of Tamil Nadu: An Examination of Public Finances 2021-22 to 2025-26.
- It puts Tamil Nadu’s debt at ₹13.18 lakh crore, including the combined debt of public sector undertakings (PSUs).
- It says the headline debt figure of ₹10 lakh crore in 2025-26 captures only the State’s direct borrowings through market loans, institutional debt, and public account liabilities; it does not capture the borrowings of the PSUs, statutory boards, and special purpose vehicles that the State guarantees or implicitly supports.
- The power sector remains the single largest source of debt among the PSUs, accounting for ₹2.47 lakh crore.
- The outstanding debt of eight government transport undertakings stands at ₹43,865 crore, while that of the Tamil Nadu Civil Supplies Corporation is ₹27,181 crore, the report said.
- Together, the outstanding debt of these PSUs stands at 3.18 lakh crore.
- The report said the State’s outstanding debt had almost doubled in the five years since April 1, 2021, rising from ₹5.13 lakh crore to nearly ₹10 lakh crore as of March 31, 2026. The debt-to-GSDP ratio has remained elevated throughout the post-COVID period and stood at 28.3% in 2025-26.
- Interest payments consume approximately 23% of the total revenue receipts and nearly 35% of the State’s Own Tax Revenue (SOTR).
- At ₹67,050 crore in 2025-26, the annual interest bill exceeds the annual capital expenditure by approximately one-third.
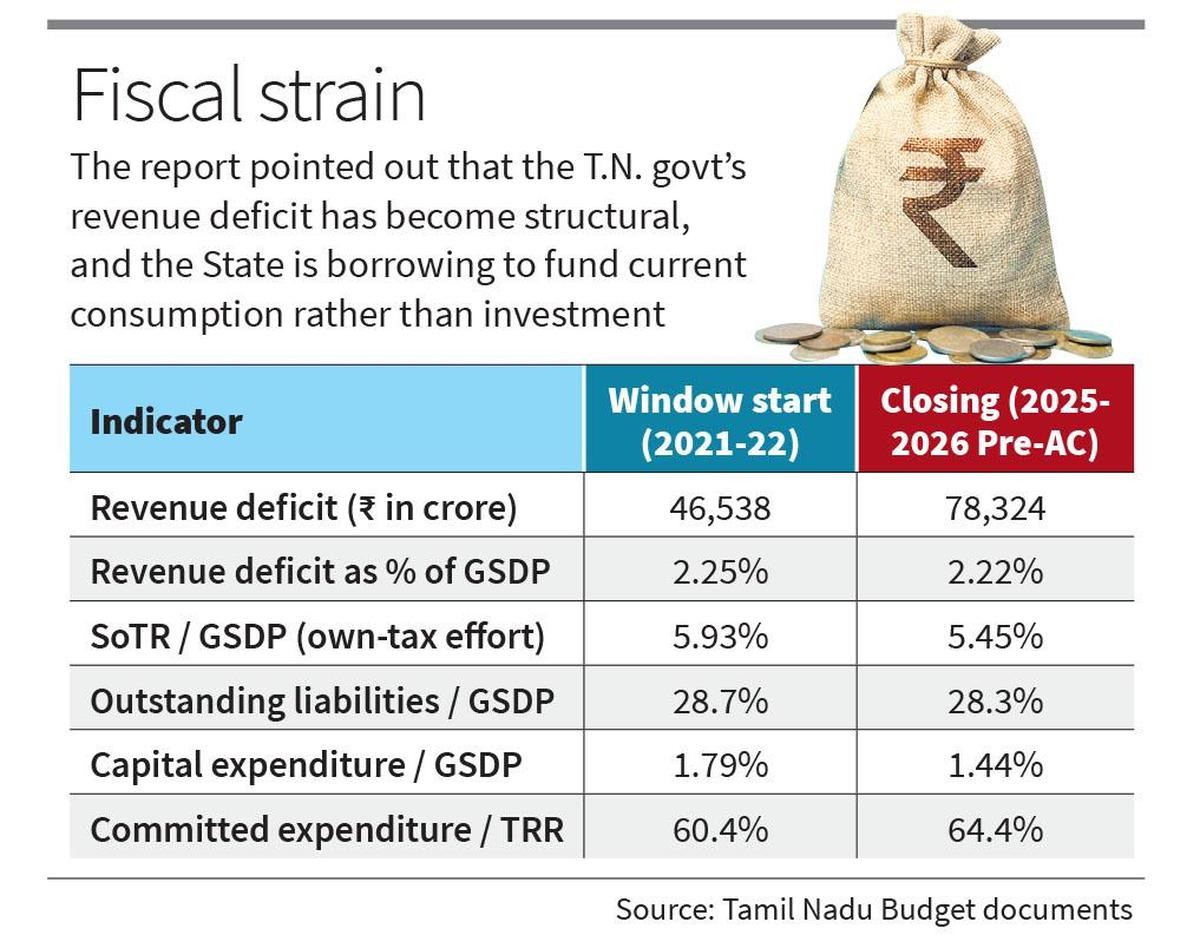
- The 2025-26 pre-actuals projects a revenue deficit of ₹78,324 crore, equivalent to 2.2% of the GSDP, the highest recorded in absolute terms and even exceeding the COVID year level.
- The State is borrowing to fund current consumption rather than investment.
- More than one-third of every rupee the State raises through its own taxation effort goes directly to servicing past debt.
- The White Paper said mining revenue was among the “most striking examples of stagnation” in the non-tax income of Tamil Nadu.
- The State had “substantial deposits” of granite, limestone, sand, quartz, vermiculite, and a range of other minor minerals.
- Royalties, rents, and seigniorage fees on minor minerals contributed to mining revenue.
- The SOTR-to-GSDP ratio has declined from 5.93% in 2021-22 to 5.45% in 2025-26. Committed expenditure, including salaries, pensions, and interest payments, is among the highest, compared with the peer States (Maharashtra, Gujarat, and Karnataka).
- It rose from ₹1.25 lakh crore to ₹1.89 lakh crore, increasing its share of revenue receipts from about 60% to 64%.
- At 11.8%, the capital expenditure-to-total expenditure ratio is the lowest among the peer States.
- Tamil Nadu Fiscal Responsibility Act, 2003, has been amended eight times so far to defer achieving a zero-revenue deficit and limiting the fiscal deficit to 3%.
- The report also highlighted the growing elderly population, which is projected to account for 18.2% of the State’s total population by 2031.
- According to the Union Ministry of Health and Family Welfare’s population projections, Tamil Nadu will have the highest proportion of elderly people among the major States by 2031.
- It refers to Tamil Nadu having the second largest GSDP size (next to Maharashtra) with a diversified industrial and services economy, apart from a large formal-sector tax base.
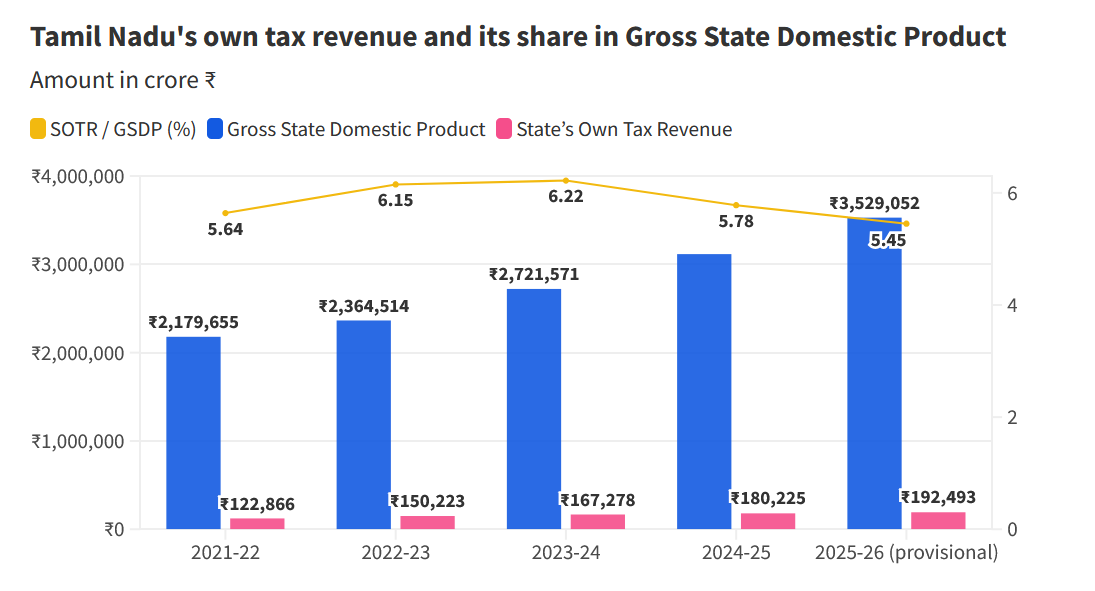
- The State’s Own Tax Revenue (SOTR) constitutes about two-thirds of the total revenue receipts (TRR).
- The State’s “own-tax revenue is drawn from five principal sources”.
- It pertained to commercial taxes (Goods and Services Tax), Value Added Tax (VAT) on petroleum, State Excise and VAT on liquor, Stamps & Registration, Motor Vehicle Tax, and other taxes.
- Within the broader commercial taxes, GST accounted for around 53%; VAT on liquor, 28%; and VAT on petroleum products, 19%.
- The trend of growth in Tamil Nadu’s consumption of diesel and petrol is well below the real GSDP [Gross State Domestic Product] growth rate of around 7% per annum in the last 10 years.
- Tamil Nadu’s consumption of petrol and diesel was reaching a point of stagnation.
- The document attributed the development to improving fuel efficiency, the growing adoption of Compressed Natural Gas (CNG) and electric vehicles, and the shift of freight traffic patterns.

Leave a Reply
Your Comment is awaiting moderation.